Debugging large codebases can be a daunting task for developers. As the complexity of the code increases, so does the potential for bugs and issues. Xcode, the integrated development environment (IDE) for iOS and macOS development, provides powerful debugging tools to help developers identify and resolve issues efficiently. In this article, we will explore some tips and strategies for debugging large codebases with Xcode.
Understand the Codebase
Before diving into debugging, take the time to understand the codebase thoroughly. Familiarize yourself with the architecture, design patterns, and dependencies. This knowledge will help you navigate through the codebase more effectively and understand the context of the issues you encounter.
Utilize Xcode’s Debugger
Xcode’s built-in debugger is a powerful tool for stepping through code and inspecting variables at runtime. Set breakpoints at relevant locations in your code and use the debugger to analyze the state of your application. You can step into, step over, or step out of code sections to trace the execution path and identify potential issues.
Enable Exception Breakpoints
Exception breakpoints are an essential feature in Xcode for debugging. They pause the execution of your application whenever an exception is thrown, allowing you to inspect the stack trace and identify the source of the exception. Enable exception breakpoints to catch and resolve exceptions quickly.
Utilize Conditional Breakpoints
Conditional breakpoints allow you to set breakpoints that are triggered only when specific conditions are met. This feature is invaluable when debugging large codebases as it helps narrow down the scope of the debugging process. Set conditional breakpoints on relevant code sections to focus on specific scenarios or conditions that may be causing issues.
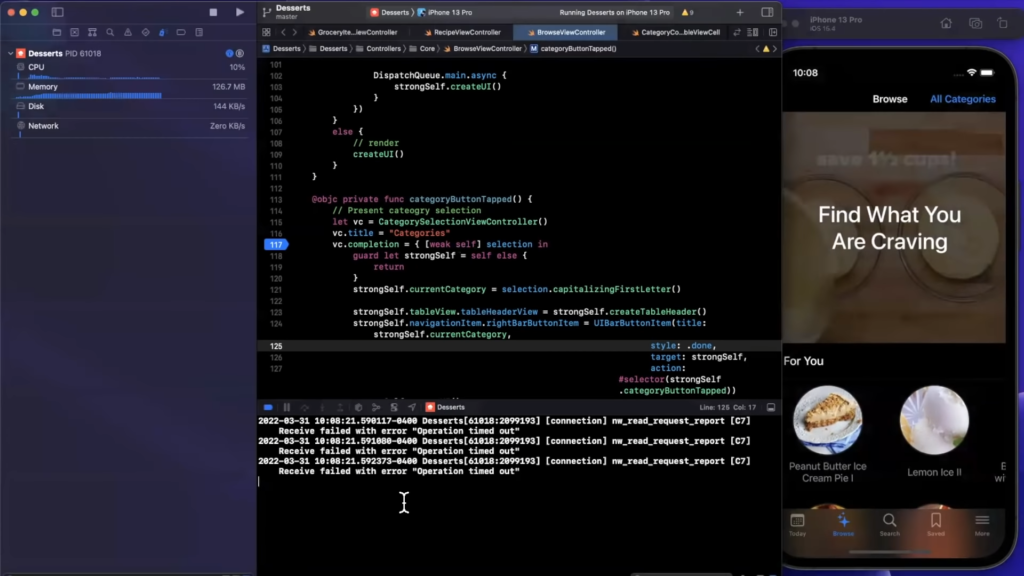
Use Logging and Console Output
Logging is a classic debugging technique that can be used effectively in large codebases. Insert log statements strategically throughout your code to print out relevant information. Xcode’s console output provides real-time feedback, allowing you to track the flow of your application and identify any unexpected behavior or values.
Leverage Xcode’s Instruments
Xcode’s Instruments tool provides a range of performance and debugging instruments to analyze your application’s behavior. Instruments can help you identify memory leaks, CPU usage, and performance bottlenecks. Use instruments like the Time Profiler, Allocations, and Leaks to gain insights into your application’s performance and pinpoint potential issues.
Reproduce Issues Consistently
When debugging large codebases, it’s crucial to be able to consistently reproduce the issues you’re facing. Reproducible issues make it easier to isolate and analyze the root cause. Take note of the steps, inputs, or conditions that trigger the problem and ensure you can reliably reproduce it before diving into debugging.
Break Down the Problem
Large codebases often consist of multiple modules or components. When encountering an issue, break it down into smaller, manageable parts. Narrow down the scope of your debugging by isolating specific modules or components. This approach helps in pinpointing the source of the problem and reduces the complexity of the debugging process.
Use Source Control for Debugging
Source control systems like Git can be valuable tools for debugging large codebases. By utilizing branching and versioning, you can create separate branches to experiment with fixes or modifications without affecting the main codebase. This allows you to isolate and test potential solutions, making the debugging process more controlled and manageable.
Collaborate and Seek Help
Debugging large codebases can sometimes be a collaborative effort. Don’t hesitate to reach out to your team members or online developer communities for assistance. Explaining the issue to others can often lead to fresh perspectives and insights. Collaborating with others can also help in sharing the debugging workload and accelerating the resolution process.
Debugging large codebases in Xcode requires a systematic approach and the utilization of its powerful debugging tools. By understanding the codebase, leveraging Xcode’s debugger, using breakpoints effectively, logging and using console output, utilizing Instruments for performance analysis, reproducing issues consistently, breaking down problems into smaller parts, using source control for debugging, and seeking collaboration when needed, you can effectively identify and resolve issues in large codebases. With these tips and strategies, you’ll be equipped to debug your Xcode projects more efficiently and deliver high-quality software.